Investment Thesis
Target (TGT) delivered strong Q3 2018 results, but the stock price has only moved downward since the announcement. I do not believe the decline is justified; if anything, Target should have traded the opposite way.
There is no getting around the pile of debt consumers and Target have accumulated over the years. These are two of the overarching issues that are driving investors out of Target’s stock (and retail in general). Furthermore, I still think certain investors feel some of the lagging sentiment that Amazon (AMZN) will put all of their competitors out of business. As a result, the market is periodically littered with great bargains in the retail sector.
When deciding where to put your hard-earned money, it is always wise to examine the business you want to buy and its closest competitors. Today, I want to offer that by comparing Target’s EVA (Economic Value Added) to Walmart’s (WMT) and Costco’s (COST) as well.
And why should you care about EVA, and what it is?
Because it is highly correlated to stock prices.

Source
Q3 2018 Results
Target reported adjusted EPS of $1.09, which was 20% higher than last year (and set a new all-time high record). FY adjusted EPS is expected to be within the range of $5.30-5.50, which is about 15% higher than last year. Comps were up 5.1%, but even better, digital comps were up by 49%.
For comparison’s sake, Walmart’s comps were up 3.4%, and digital comps were up 43%. Costco’s comps were up 8.8%, and digital comps were up 32.3%. And the cherry on top is that Target managed to grow market share in every one of their major categories.
Since e-commerce is going to be a powerhouse behind future growth, I want to focus on what Target is doing right. First off, they offer numerous fulfillment options which adds incredible utility for the consumer. Ship-from-store volume more than doubled, and in-store pickup accounted for about 15% of their digital volume. They are also seeing strong growth in Restock, However, other shipment modes are flat. I wrote about this in my last piece, but initiatives like Shipt and Drive Up are relatively newer, so those will take time to build awareness and roll out across all stores.
And lastly, Target’s after-tax ROIC over the last twelve months was 13.9% (about 50 basis points higher than a year ago). Since ROIC is a measure of profitability, it must be compared to its accompanying costs. Simply stating a company’s ROIC is 13.9% is analogous to stating a company’s revenue was $1 billion. Is that good? Impossible to tell without knowing what their costs were for that period. In evaluating ROIC, we have to compare it to the Weighted Average Cost of Capital or WACC. Target’s WACC is 7.49%. Since 13.9% > 7.49%, management has made excellent decisions over the past twelve months.
Note: Costco’s comps are for Q1 2019 (they report on a shifted calendar). Target reports that their ROIC was 15.8% for the trailing twelve months through Q3. However, this reflects tax benefits from last year’s tax reform bill.
Stock Price Plummets
Overall, the results were great – Target delivered solid comps and excellent digital sales. More importantly, they demonstrated a deep understanding of the marketplace and are rolling out a bunch of initiatives that will help them compete for years to come. So, why did the stock price plummet?
Margins

Data acquired via 10Q
Gross margins came under pressure this quarter, dropping by about 1%. Judging by analyst obsession on the conference call, one would have thought that they fell by 10%. Margins fluctuate in the course of business, and this share price dip offers investors who held reservations an opportunity to open a position.
The question we have to ask is, ‘Why did margins fall?’ There are specifically two main reasons – growth in inventory and the impact of digital fulfillment.
Let’s start with the easy one first. The extra expense associated with the growth in inventory was simply related to the size and timing of the inventory receipt since, this year, we had the earliest Black Friday and Thanksgiving that the calendar will allow. Supply chain costs to process and receive the inventory were higher than expected in anticipation of the huge fourth quarter, fueled by the investments Target was making in the Toys category to capture sales from the Toys R Us bankruptcy.
The first step in order to keep up with demand is to secure supply. However, moving that supply can be costly, especially with transportation costs rising. The extra cost incurred in order to procure and ship these additional products put downward pressure on margins.
This leads us right into the second reason, which is that the digital channels have higher costs associated with them due to the shipping components. The economics are obviously worse when you are forced to ship a product rather than sell it in store. Target did not anticipate 49% digital growth (a good thing in reality) and wound up having higher supply chain costs as a result.
Strangely, the analysts looked at these two facts as negatives. Look, if you have products which are being demanded faster than they can be supplied, that is a good thing. The increase in inventory was not because Target felt like loading up the balance sheet for fun, it’s because consumers want the stuff Target has to sell. If you are going to have margin erosion, you want it to be from the fact that your products are in constant demand because there are many solutions which can offset that erosion. It is difficult to offset margin erosion when your products are not in demand, because, in that case, you really don’t have a choice but to lower prices in the short run (to stimulate the demand), which only hurts your margins more.
So, what is Target doing in order to offset the margin erosion? First, when it comes to inventory “glut,” Target offsets that with their merchant initiatives. This reduces their cost of goods sold and puts upward pressure on margins. They are also looking into automation to reduce their costs further (although this would decrease SGA which wouldn’t impact gross margin but EBIT margins instead). Lastly, Target has other unspecified ways to offset any incremental cost through an assortment of options.
Second, the initiatives Target has put into place such as Shipt, Restock, and Drive Up are all relatively new and in their infancy and are not even available across all markets. As these programs mature and Target figures out the best strategy to stabilize costs, any prior margin erosion will be reversed. Brian Cornell stated in the recent earnings call that we can expect to see a meaningful impact over the next two to three years.
Sales Miss
EPS missed by ¢2/share, and sales came in under expectations by $110 million. However, sales were still up 5.6% YoY. The market punished Target too much for a “sales miss” when in reality it was a sales beat – just not to the tune of analysts’ expectations.
But I believe that Target has a huge opportunity to increase sales going forward by utilizing digital advertising. Cornell stated that this is something Target is thinking about, but then abruptly ended the earnings call without saying anything more. Target has a lot of traffic on its website and could monetize that data which could be a large boost to earnings. The great thing here is that this is a recurring revenue scheme, which will benefit the long-term investor. That combined with the high profitability I expect via their new fulfillment options will promote future sales beats, not sales misses.
Risks
Moving on to arguably the most important aspect of buying any business, the risks involved. I believe there are two looming risks hanging over Target that investors should be cognitive of and they are…
Consumer Debt
Target is a cyclical business and is highly dependent on consumer disposable income. I believe the US economy is not as strong as everyone seems to believe, and I say that based off of one big reason: consumers are levered up to their necks.
The New York Fed issued a press release back in August which stated that aggregate household debt grew for the 16th consecutive quarter. Credit Card debt was $45 billion higher YoY for Q2 2018 with 7.9% of balances 90 or more days delinquent. This an absolute must-read press release if you are considering buying Target.
Some of you may already be familiar with what I am about to quote, but there is a great analogy (introduced by Peter Schiff) which goes something like this:
Imagine you meet a friend from high school after 30 years and you ask him ‘Hey how ya doing man??’ and he tells you that he just took out a second mortgage on his house, he’s maxed out four credit cards, and he’s blown through his retirement savings in order to shop more. This guy might own a lot of stuff, but would your conclusion be “This guy is doing great?”
Now imagine you meet another friend right down the street (what a day, right?) and you ask him the same question and he tells you that he has paid off his mortgage, maxed out his 401k, and saved a million dollars. Which guy is doing better? This analogy can be transposed to the US economy.
An economy that constantly spends borrowed money and goes deeper and deeper into debt is not healthy. Many of Target’s consumers are short on cash. The only reason they can shop at all is because money is free to borrow when rates are zero (as they were for years up until recently). But as rates rise and inflation rises, servicing that debt becomes exponentially more difficult. As higher prices force consumers to default on their debt obligations, Target’s sales will suffer.
In my last article, I wrote that the initiatives that Target put forth should help drive sales in the future. Those initiatives, while absolutely fantastic, are rendered moot if we have a debt crisis and consequently, will only realize full profitability in the long run.
Target’s Debt
Now, moving on to another real risk I believe Target investors should be aware of, Target’s own huge pile of debt. Target’s debt to capital ratio comes out to be over 50% when you include their operating leases, which although classified as an “off balance sheet activity” is still debt and must be considered.
Like I stated earlier, this past decade has seen unbelievably low interest rates, and companies have taken advantage of that by borrowing beyond their means. Mal-investments get exposed when rates normalize. If you have a project with an IRR of 4%, and the cost of those cash flows is expensed at 2%, it looks like you can go ahead with the project as it appears profitable (4% – 2% = 2% revenue).
However, when rates rise, that profitability gets overrun and can easily turn into a loss if rates rise enough to push the cost of those cash flows higher than the profits. These projects go bust, become a huge waste of cash, and misallocate all the factors of production involved in going forth with the project in the first place. This is inefficient and to the detriment of the shareholders.
In the case of Target, they took on all this debt in order to adapt their business to compete in this rapidly changing retail environment. I understand that to compete with Amazon, they have to invest heavily in their infrastructure. But that does come with a real risk. As I stated above, if interest rates rise, it makes servicing debt much more expensive. It also forces Target to offer much higher rates of return on any new notes they issue.
More cash going out the door makes the business worth less, and if interest rates rise dramatically (which would be a necessity if inflation rises uncontrollably), then many companies could be forced to default on their payments. Therefore, it is not solely interest rate risk, but also inflationary risk. And although Target has middle ‘A’ credit ratings across the board, those ratings can change with the blink of an eye if things go bad (which is why I do not overemphasize good credit ratings because I understand they are fickle).
Speaking of default, we can measure solvency, which is a measure of a company’s ability to meet its long-term obligations. Let’s take a look at Target’s solvency ratio for the last ten years.

Source: DocShahEconomics/Data acquired via 10k
Generally, we want companies’ solvency ratios to be over 20%, and unfortunately, Target fell short every single year except for 2015. They get an overall C+ grade since they have improved solvency about 3.5% each year the past decade. However, given that it was already so low to begin with, they should have improved it by more. I am not uncomfortable with Target’s current solvency ratio per se, but I would like that to be improved by 120 basis points at least.
Devil’s Advocate
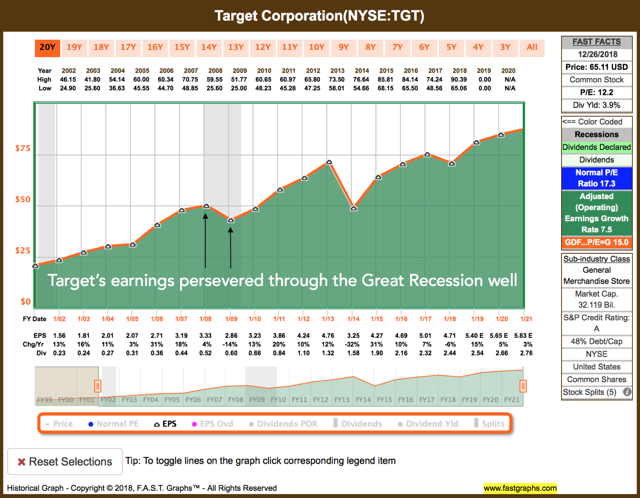
With all that being said, if you are a long-term investor, this risk becomes “smoothed out” over a long period. It is important to emphasize when you buy a share of a company, you are a part owner of that company. Bill Gates did not sit around thinking “Oh man looks like a recession might come in a couple months, guess it’s time for me to pack up and sell Microsoft!” Bill Gates was the owner, believed in his products, and weathered any storm that was outside the business.
Source
We can see a similar story with Target. Since Target’s earnings only dipped slightly during the Great Recession, that gives me confidence that they can battle some of the strongest economic downturns.
Understand that your buy order for a company should realistically come with the implication that you believe in management’s ability to adapt to any market. If you cannot confidently state that your company has an excellent management team which provides excellent products and services which will enable them to adapt to any climate, then you should not buy that business.
Competitor Comparison
I want to compare Target to Costco and Walmart in terms of ROIC and, most importantly, EVA (Economic Value Added). This analysis will allow us to see which company creates the most value for shareholders and offers insight as to where is the best place to “park” one’s money.
ROIC

Data acquired via 10k
Remember, we have to compare ROIC with WACC (profit verse cost). Target comes in third place as both Costco and Walmart have created more value. In fact, I would argue that Target’s ROIC is quite low, which ties into my theory why the company has been pegged to a 15 PE. I wrote previously that Target’s earnings have only grown by 1.20% per year over the last decade. This fact combined with the lower-than-expected value creation leads me to believe the market is pricing Target accordingly. In contrast, both Costco and Walmart have seen their share prices soar in recent years.
EVA
EVA is the true measure of a firm’s profitability and is far superior to ROIC because it considers the conventional cost of debt (interest expense), the usually ignored cost of equity (expected return demanded by the shareholders), and the capital employed (productive assets and working capital).
EVA shows how much value a company creates by quantifying the net cash that is returned to the shareholder (analogous to net present value). Essentially, we are looking at how much money does the company generate after it clears its cost of capital hurdle.
In order to calculate EVA accurately, we have to convert accrual basis accounting into cash basis and make the appropriate adjustments to Net Operating Profit After Tax or NOPAT. We will start with analyzing Target’s EVA and then compare it to Costco’s and Walmart’s EVA.
Target’s EVA

Data acquired via 10k
Economic Value Added is calculated using this very simple formula:
NOPAT – (WACC * Invested Capital)
In order to calculate NOPAT, we have to make a series of adjustments. We first have to capitalize and amortize both R&D Expense and Advertising Expense. Then, we have to eliminate the financing decision of operating leases and add back the implied “interest portion” of the rental payment. Lastly, we have to determine the company’s cash operating taxes. GAAP taxes are calculated on an accrual basis (and applied to pretax income) and remember, we need to calculate EVA taxes, which are on a cash basis (and applied to adjusted operating income). Once we have all of our adjustments, we can calculate Target’s NOPAT, which comes out to be $3,392.5 million.

Data acquired via 10k
In order to determine WACC, we have to calculate the blended costs from Target’s various sources of financing. Bondholders demand a specific rate of return and stockholders demand a specific rate of return. Therefore, the cost of the capital supplied by investors to the company is the return the company has to give back to those investors.
Target’s after-tax cost of debt is 3.29% and their cost of equity (Ke) is 9.52%. Once the weights are applied, WACC comes out to be 7.49%.

Data acquired via 10k
Invested capital is the sum of long-term sources of financing (both debt and equity) that are invested in a company. There are a few adjustments that have to be made. We have to capitalize R&D, advertising, and convert operating leases into present value debt dollars. Target’s total invested capital comes out to be $31,057 million.

Data acquired via 10k
Alas, we have all the pieces to the equation. Target created $1.06 billion dollars of shareholder value in 2017. Management made excellent decisions this past FY and rewarded the shareholders handsomely. Make no mistake, this is a good number by itself, but we really need to put it in comparison to Costco and Walmart to gain perspective.
EVA Comparison

Data acquired via 10k
Here are the EVA comparisons between Target, Costco, and Walmart for their most recent fiscal years on report.
Target and Costco have similar NOPATs and EVAs, but notice Costco had less invested capital (and at a higher cost), indicating that their operations were far more productive at producing cash via capital deployment.
Target and Walmart have very different numbers. Walmart earned over 4x times the NOPAT that Target did, but wound up with over 6x the EVA that Target had. This indicates that Walmart was far more productive at producing cash via capital deployment as well.
Valuation Overlook
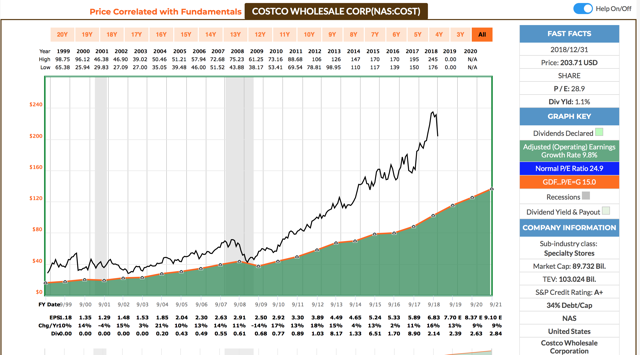
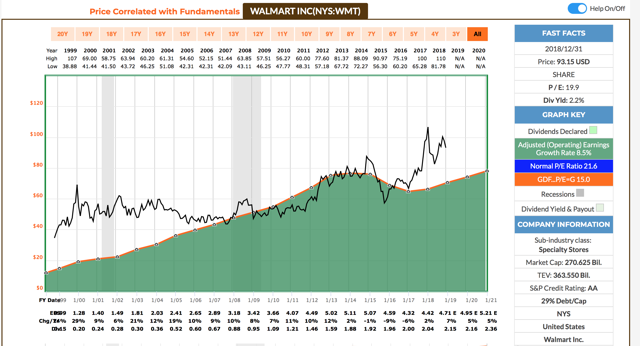
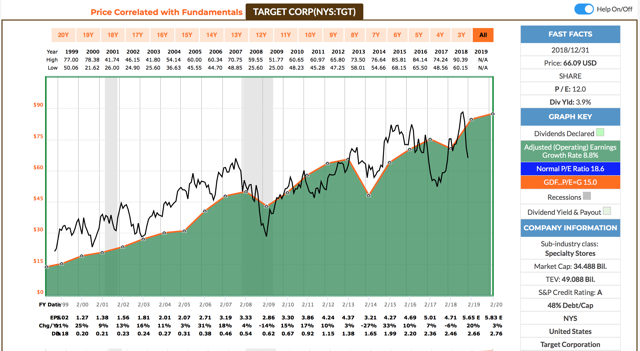
Remember when I said EVA is highly correlated to stock prices?
Source for all graphs
Based off the EVA comparison, I would predict that Costco and Walmart would have the highest stock price/valuations based off of earnings and that Target would be last. And this is exactly what we see.
In fact, Costco and Walmart are overvalued (black line represents stock price and the green shaded area represents earnings). Their respective blended PE ratios are 29 and 20, whereas Target’s is only 12. The market has applied a premium to these companies as their EVAs are stronger than Target’s EVA.
However, given that these two companies are overvalued, Target is the best buy. Yes, their EVA quality was last when compared to Walmart and Costco, but it was still good, and the company should be trading at a higher PE multiple. Target has traded at a normal PE of 15 over the last decade, which shows not only do we have upside to go in the short run, but in the long run, I believe we will breakthrough that PE.
Takeaway
Target’s sales “miss” and margin compression is not something I am concerned about as a long-term investor. I believe the business is adapting to the new retail environment and has incredibly strong brand perception amongst consumers.
With that being said, debt on the consumer side and company side is incredibly high and does pose risks that every investor should be aware of if they are interested in opening a position. However, if Target’s management team can weather The Great Recession, I have confidence they can handle a vast majority of any potential headwinds that might arise.
In regards to EVA, Costco and Walmart are great businesses, but the price you pay to own those businesses is incredibly important. I believe investors have an opportunity to buy shares of Target, an equally great business, at a much cheaper price/PE multiple. Target’s undervaluation at this point in time offers great upside when compared to its overvalued competitors.
Note: For anyone new to the DocShah Economics family, we analyze businesses as holistically as we can. Next up will be the reader favorite, The Valuation Article.
Disclaimer: Neither this article nor any comment associated with it is to be taken as financial advice. Investors should always do their own research before executing any financial transaction.

